If you've paid attention to me for more than five minutes, you’ll know that I love the Quantity Theory of Money. I’ve spent much time defending the basic principles of it, and I base much of my work on its assumptions. In this post, I want to defend it further by outlining a clear and consistent view on how I think it works, and how it should be applied to the present crisis.
The Hot Potato Effect
Before you understand my view of quantity theory, you must understand what is called “the Hot Potato Effect”. The Hot Potato Effect is an alternative microfoundation of the Quantity Theory of Money to simply looking at money supply per output. The Hot Potato Effect is derived from basic microeconomic principles and can best be explained via Milton Friedman’s work1 (even though he did not himself acknowledge it).
Imagine it thusly: each person has a real cash balance that they wish to maintain, and this real cash balance exists because cash is a lever against uncertainty. Thus, as volatility increases, so does this real cash balance.
When the central bank creates money, it increases the amount of real cash in the economy. This can mean two things. First, people can use this new money to fulfill their real cash balance. Second, they can “hot potato” it away because they already have all the real cash they need. This induces a surplus of dollars, making the real value of dollars less and making the equilibrium price level higher (as the value of a nominal dollar is one dollar, always and everywhere). The lower the real price of cash, the lower the equilibrium balance, and thus the real cash balances are readjusted to their equilibrium level.
If you are saying to yourself, “isn’t this just supply and demand with money,” you’re right! Rather, the Hot Potato Effect applies to all goods. It’s just that understanding the individual portfolio is most important in regards to money.
The Significance of the Hot Potato Effect
To understand the significance of the Hot Potato Effect, we must view it in the contexts of both Quantity Theory equations. Then, we can see how the simple concept of supply and demand applied to money completely blows open monetary economics.
The Cambridge definition of money demand2 is M^d = k * P * Y, where M^d is money demand, k is the real cash balance, P is the price level, and Y is real output. Pretty standard. Rewriting the equation to solve for the price level, we get P = M^d / (k * Y).
The Classical definition of the price level is M * V = P * Y. M is the money supply, V the velocity of money, P the price level, and Y real output. Of course, we should rewrite this to P = (M * V) / Y.
Looking at our Cambridge definition, we can see that money demand increases when real cash balances increase, and the price level decreases when they increase. If, at equilibrium, M^d = M (money supply), then an increase in the price level makes prices increase. From that, we derive k = 1/V. Money demand and real balances thusly can counteract the original Quantity Theory of Money. Only when they are static do we see the quantity relationship take hold.
It is important to note, however, that k usually returns to its “normal” level at some point. This means the quantity relationship holds in the long run.
Quantity Theory In Action
Quantity Theory most simply states that ΔM ≈ ΔP. This happens when Δk = 0, as I will demonstrate. Here is a quantity process when Δk = 0:
The growth rate of M, ΔM, increases.
The growth rate V, ΔV, is equal to 0 because Δk = 0.
Solving for price level change, ΔM - ΔY = ΔP. Inflation is only counteracted by real growth.
However, something different happens when Δk > 0.
The growth rate of M, ΔM, increases.
The growth rate V, ΔV, is less than 0 because Δk > 0.
Solving for price level change, ΔM - Δk - ΔY = ΔP. Thus, a new variable is added that can counteract inflation.
Real balances only increase under specific circumstances, and they are hard to estimate. When there is extreme recession risk, real balances increase because of uncertainty. As interest rates get lower, real balances increase because the opportunity cost of holding money is lower. Finally, if ΔM^d > ΔM, 1/k > V, and real balances increase because money demand increases. Money demand increases due to the two described factors above.
I believe we are in the second case at the moment. This is why I believe Quantity Theory “lives”.
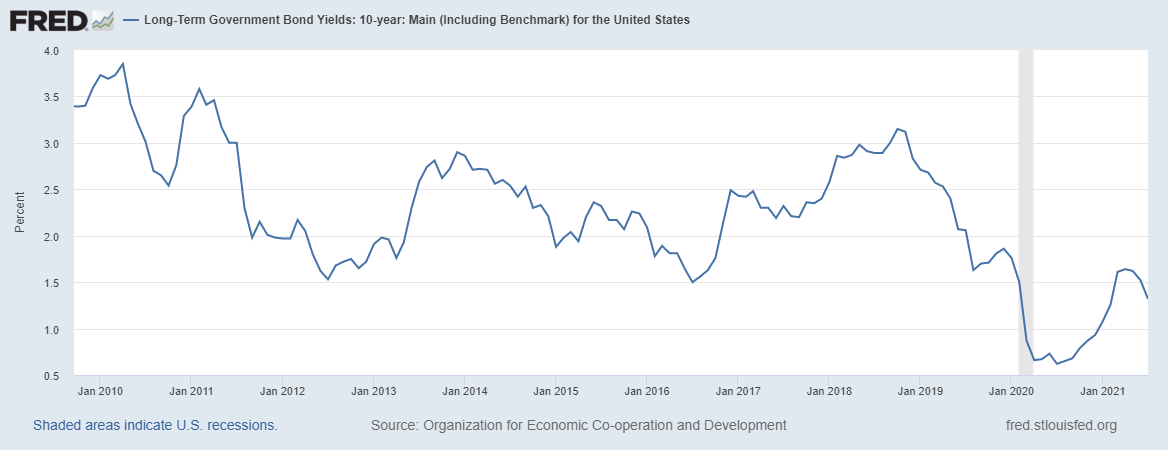
For example, we can consider the case of bond yields as evidence on money demand. By creeping lower and lower, yields indicate that k is creeping higher and higher. This is why true Quantity Theorists aren’t worried about inflation in the short term.
Some Empirical Evidence for Quantity Theory
There are a couple of tests I want to run for Quantity Theory in the US in the long run. First, there is a Lucas paper3 that I wish to replicate. Second, there is a famous international study4 that I will re-examine only in the context of the USA. I will be using quarterly M2 and PCE chain-type price index from FRED.
First, my test of the Lucas paper. I ran an EWMA filter on the data, just like in the paper, and used a recursive least squares regression. My R^2 was 0.674.
As you can see, the primary source of divergence occurs around 2008, when banks start taking on excess reserves. That can be a sign of an increase in k.
Second, I ran an OLS regression to replicate McCandless and Weber. My R^2 was 0.852. As you can see, the regression begins to break down with the extraordinary M2 growth rates we saw during the Great Recession.
You may say, “but Joshua! The correlation breaks down! Doesn’t that disprove the QTM?” I say that it merely indicates a shift in real cash balances. This breakdown obviously does not start until the recession happens. Recessions cause higher real cash balances.
When I took regressions from before the Great Recession using both methods, I got R^2 of 0.9 and 0.968, respectively. Obviously, a good statistician would not eyeball this date as a breakdown point, like I have. Still, believe it does indicate a shift in what variables changed, especially if you believe in the relationship between excess reserves and velocity.
Empirical Evidence on Money Demand
Here are a couple pieces of evidence for current excess money demand:
-Total reserves are growing higher. This indicates increased uncertainty and desire for financial liquidity.
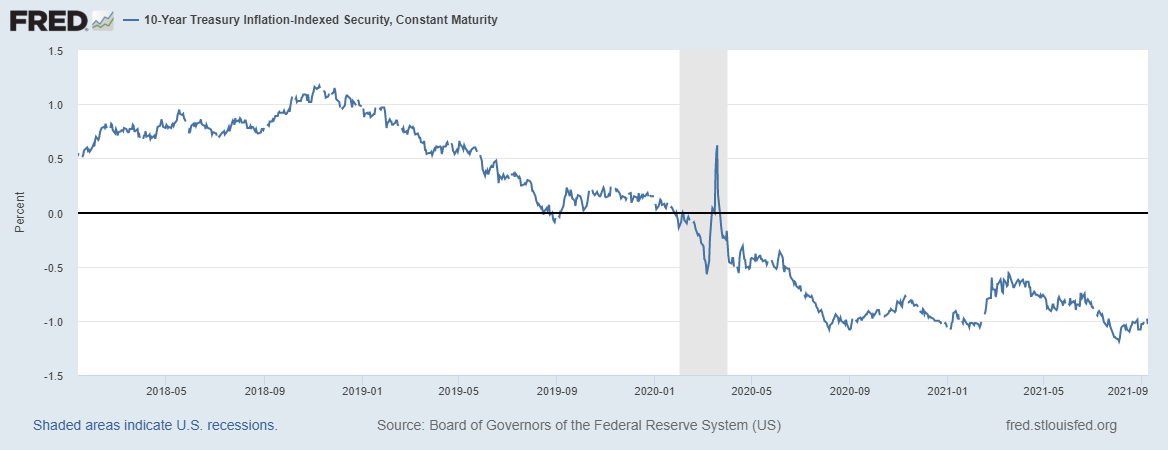
-Real rates (as approximated by TIPS) are continually low. This indicates a lower opportunity cost of holding cash.
The conclusion of all this? Quantity Theory must be practiced with money demand first in mind. In the near future, when money demand does not affect money supply as normal, normal Quantity Theory will be useless for analysis.
HT: Trevor Chow, Basil Halperin, Scott Sumner.
Friedman, Milton. 1969. “The Optimum Quantity of Money.” In The Optimum Quantity of Money and Other Essays, 1-50. London: Macmillan and Company Ltd.
Pigou, A. C. 1917. “The Value of Money.” The Quarterly Journal of Economics 32 (issue 1): 38-65.
Lucas, Robert E. 1980. “Two Illustrations of the Quantity Theory of Money.” The American Economic Review 70 (1980): 1005-1014.
McCandless, George T, & Warren E. Weber. 1995. "Some Monetary Facts." Federal Reserve Bank of Minneapolis Quarterly Review 19: 2-11.


